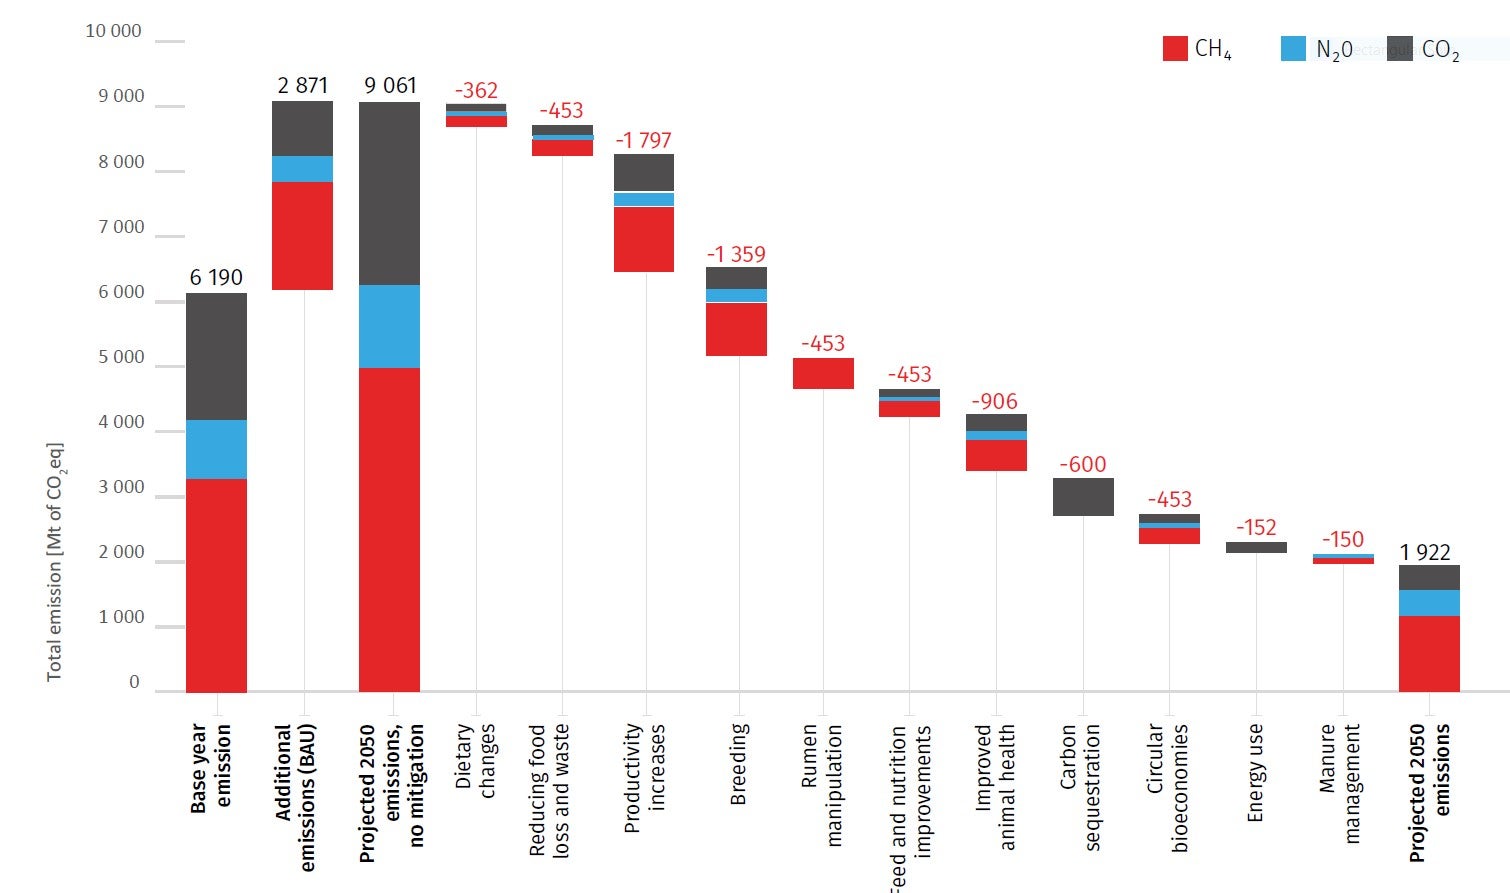
Figure 2. Base year and projected emissions from livestock systems shown as a waterfall chart with a range of mitigation measures applied to 2050 with their technical potential Note: 100 percent adoption is assumed. Interventions are assumed to have cumulative impacts and the order of interventions is thematically structured, without the intention to rank them for their importance.
Base-year2-2-.jpg
 Biobeef Blog
- Addressing the 2050 Demand for Terrestrial Animal Source Food December 2, 2024I have a paper entitled “Addressing the 2050 demand for terrestrial animal source food”, in @PNASNews Special Feature on the Sustainability of Animal-Sourced Foods and Plant-Based Alternatives., published today. This Feature includes several articles that consider the sustainability implications of replacing milk, meat and eggs with alternative proteins at scale. The significance statement (aka the […]
- A decade since IQ2 GM Food Debate December 1, 2024Ten years ago on December 3, 2014, I participated in an Intelligence Squared (IQ2) debate in the Kaufmann theater New York City. The topic was “Genetically Modify Food”, and unexpectedly following the 90-min debate the side arguing for GMO Food, myself and Monsanto executive vice president and chief technology officer Rob Fraley, swayed a large […]
- Funding Announced for Cooperative Research Centre (CRC) for Zero Net Emissions from Australian Agriculture December 12, 2023AMAZING. Today the Australian Government Department of Industry, Science, Energy and Resources announced it is funding the Cooperative Research Centre (CRC) for Zero Net Emissions from Agriculture (ZNE-Ag) to the tune of AUD $87 million to further develop and scale up technologies to reduce methane emissions from grazing cattle and sheep, and to improve crop […]
- Extension Critical to Mitigate Anticipated Increase in Livestock Sector GHG Emissions December 11, 2023A 2023 report from the FAO “Pathways towards lower emissions: A global assessment of the greenhouse gas emissions and mitigation options from livestock agrifood systems” revised their previous lifecycle assessment (LCA) estimate of the percentage of greenhouse gas (GHG) due to livestock to be 6.2 gigatonnes (Gt) of carbon dioxide equivalent (CO2eq), equating to approximately […]
- New York Times Reporting on Agriculture November 1, 2022Look I get it. The New York Times (NYT) does not like GMOs, industrial agriculture, factory farming or meat consumption. But I question the decision of such an influential media source to feature TWO front page articles detailing agriculture industry funding of agricultural scientists, Prof. Kevin Folta in 2015 and in 2022 Prof. Frank Mitloehner, […]